
Market Statistics Report for March 7, 2025
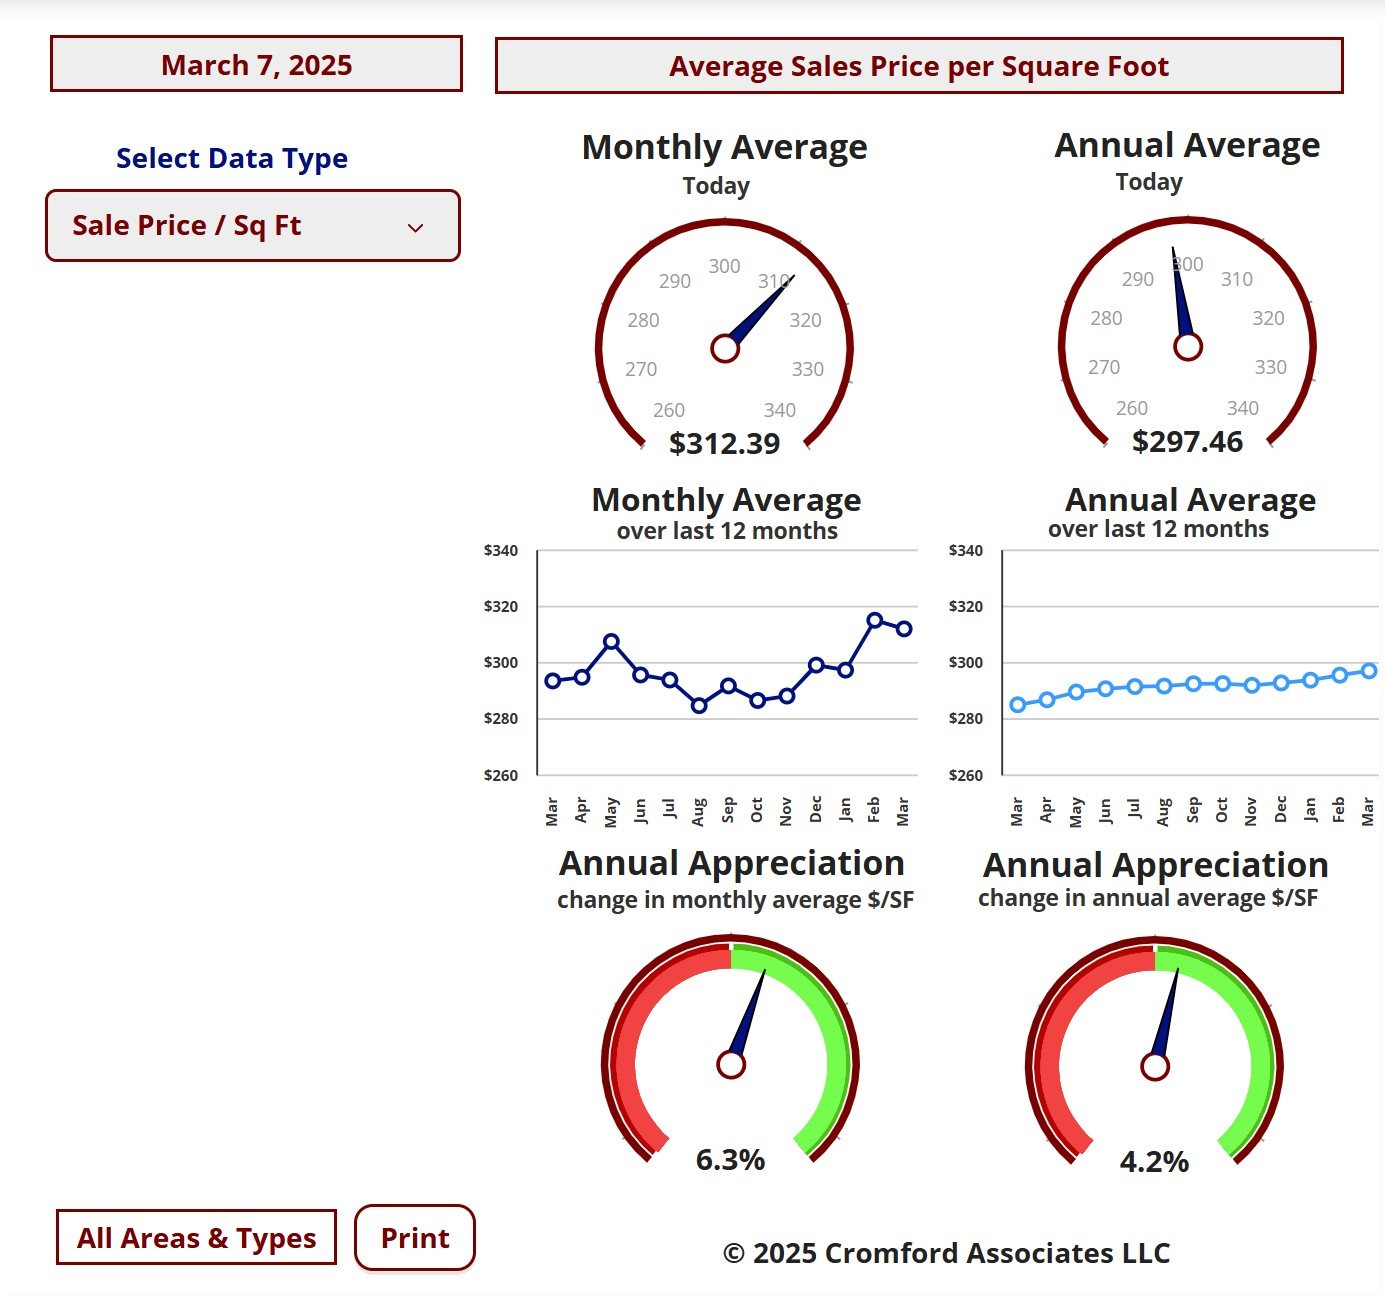
Market Dashboard – Price Per Square Foot
This Dashboard provides a comprehensive summary of the current state of the overall residential resale market.
All the statistics shown are for the entire Arizona Regional area as defined by ARMLS. All residential resale transactions
recorded by ARMLS are included. Geographically, this includes Maricopa County, a large part of Pinal County and a small
part of Yavapai county. In addition, "out of area" listings recorded on ARMLS are included, although these usually
constitute a very small percentage of total sales and have very little effect on the data.
All dwelling types are included. For-sale-by-owner, auctions and other non-MLS transactions are not included. Land,
commercial units, and multiple dwelling units are also excluded.
commercial units, and multiple dwelling units are also excluded.
City Ranking – Snapshot
This table ranks the cities by their annual average sales price per square foot. Only single family detached homes are
included in these numbers. Information for the large and secondary cities is current as of the date shown. Data for the
11 small cities is updated on a monthly basis, and is measured on the 13th of each month.The primary function of this
table is to show the least and most affordable areas in the Phoenix metropolitan area together with longer term pricing
trends.Annual averages are based on a relatively large number of sales. Therefore they are not as subject to rapid
change as monthly averages. The downside is that they do not necessarily represent the current market very
accurately, since they include sales from up to a year ago. Pricing may have moved a great deal since then.
Cromford Market Index
March 6 - Here is our latest table of Cromford® Market Index values for the single-family markets in the 17 largest
cities.
cities.
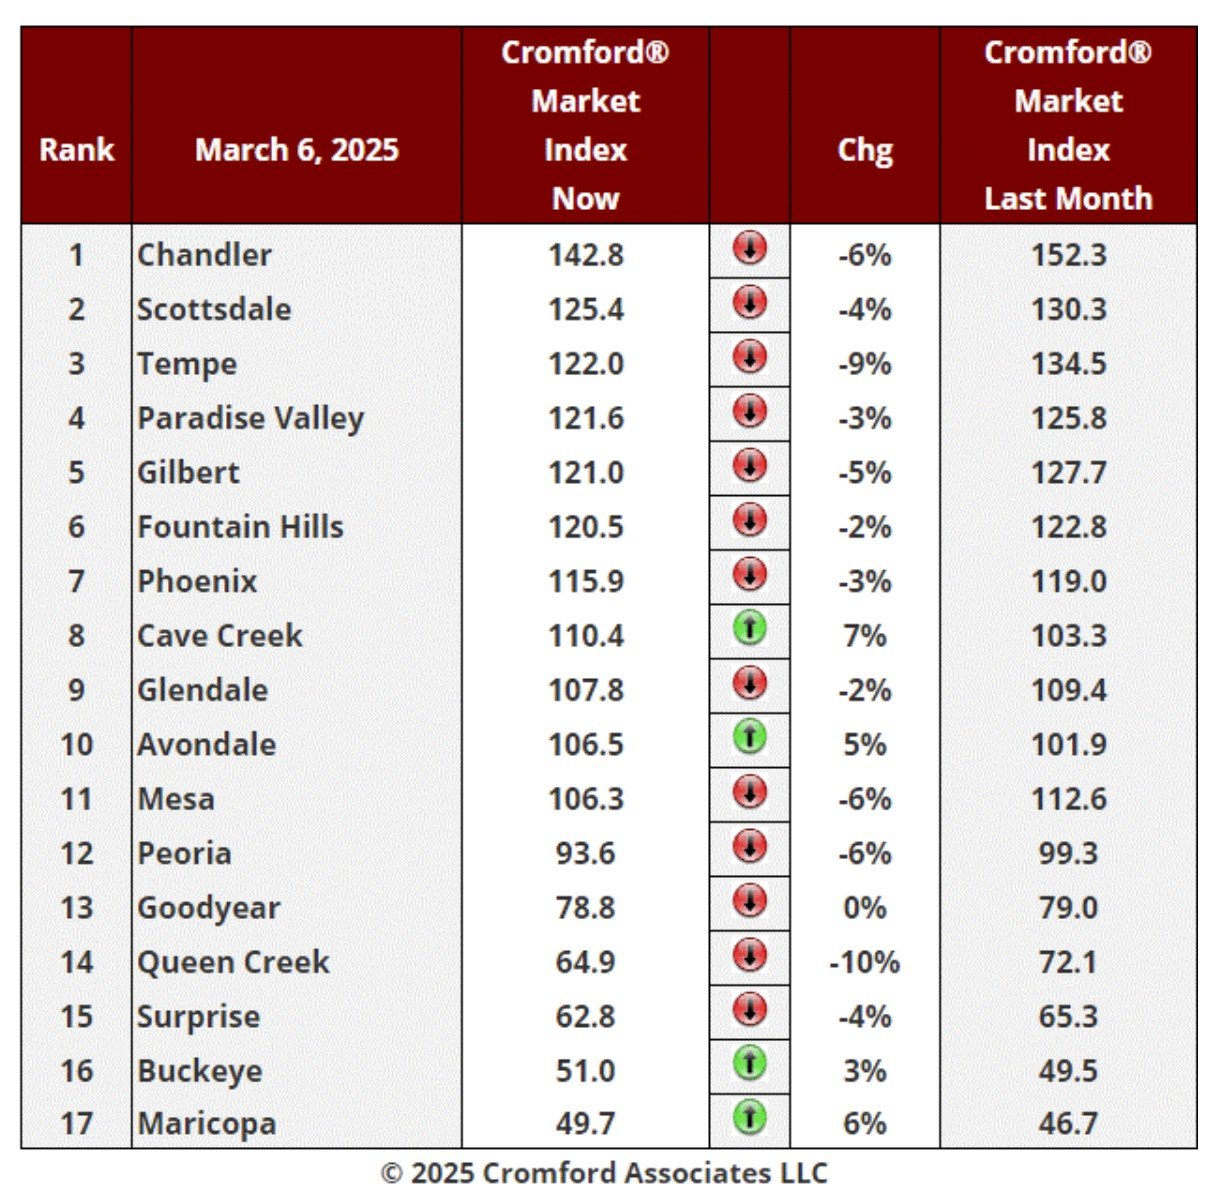
Cromford Market Index Commentary
The table is once again reporting a swing in favor of buyers. We have 15 cities that have deteriorated for
sellers over the last month with Mesa and Gilbert joining the 13 we saw last week. We only have 2 cities that
have improved over the past month, Goodyear and Cave Creek, both by small percentages. The average
change in CMI over the past month is -7.5% while last week we saw -8.0%. There is a small sliver of good
news there in that the decline is no longer accelerating.
The fastest decliners are Fountain Hills, down 15%, with Maricopa, Glendale and Paradise Valley down 12%.
But then we see Peoria down 10% with Chandler, Mesa and Tempe down 9%.
We have 7 cities that are still seller's markets, 5 that are balanced and 5 that are buyer's markets.
More listings are going under contract now that the spring selling season is properly underway. The supply
of active listings without a contract is still growing, but only by just over 2% during the past week. This is
slower than this time last month when we saw an increase of 3.2%. The contract ratio has clawed its way
back up to 37, which is low but not terrible. This time last year it stood at 52 mainly because we had far less
supply. Although CMIs are still headed lower in most places, the slight improvement in demand is starting to
slow that trend.
Among the secondary cities El Mirage, Apache Junction, Anthem and Tolleson are seller's markets, Laveen
is balanced, while Litchfield Park, Sun City, Sun City West, Arizona City, Gold Canyon, Casa Grande and
Sun Lakes are buyer's markets.
is balanced, while Litchfield Park, Sun City, Sun City West, Arizona City, Gold Canyon, Casa Grande and
Sun Lakes are buyer's markets.
Among these, Casa Grande is in a particularly strong buyer's market with a CMI of only 46.3.
Price changes are very much in vogue - they recently peaked at 3,820 per week, 52% higher than this time
last year. This is not too surprising as we do have 40% more listings now. Price cuts outnumber price
increases by about 14 to 1. The table is yet again reporting a swing in favor of buyers but the swing is getting
smaller. We have 13 cities that have deteriorated for sellers over the last month. We have twice as many
cities that have improved over the past month compared with last week. Buckeye and Maricopa have joined
Cave Creek and Avondale has replaced Goodyear. 3 of those 4 are showing improvements of 5% or more.
The average change in CMI over the past month is -2.3% while last week we saw -5.2%. This continues the
trend that started 2 weeks ago.
The 10-year Treasury Bond has seen its yield fall from a peak around 4.8% in mid-January to below 4.2% in
early March. This gives room for mortgage rates to soften and the 30-year fixed rate is now between 6.7%
and 6.8%, having been well above 7% a couple of months ago.
early March. This gives room for mortgage rates to soften and the 30-year fixed rate is now between 6.7%
and 6.8%, having been well above 7% a couple of months ago.
The fastest decliner is Queen Creek, which includes the large unincorporated county area known as San Tan
Valley. All other decliners fell by less than 10%.
Valley. All other decliners fell by less than 10%.
We have 8 cities that are still seller's markets, 4 that are balanced and 5 that are buyer's markets. This is the
same as last week.
same as last week.
New listings are still arriving too fast for demand to keep up, but the excess is smaller now than it was earlier
in the year.
in the year.
The table is yet again reporting a swing in favor of buyers but the swing is getting smaller. We have 13 cities
that have deteriorated for sellers over the last month. We have twice as many cities that have improved over
the past month compared with last week. Buckeye and Maricopa have joined Cave Creek and Avondale has
replaced Goodyear. 3 of those 4 are showing improvements of 5% or more. The average change in CMI over
the past month is -2.3% while last week we saw -5.2%. This continues the trend that started 2 weeks ago.
The 10-year Treasury Bond has seen its yield fall from a peak around 4.8% in mid-January to below 4.2% in
early March. This gives room for mortgage rates to soften and the 30-year fixed rate is now between 6.7%
and 6.8%, having been well above 7% a couple of months ago.
early March. This gives room for mortgage rates to soften and the 30-year fixed rate is now between 6.7%
and 6.8%, having been well above 7% a couple of months ago.
The fastest decliner is Queen Creek, which includes the large unincorporated county area known as San Tan
Valley. All other decliners fell by less than 10%.
Valley. All other decliners fell by less than 10%.
We have 8 cities that are still seller's markets, 4 that are balanced and 5 that are buyer's markets. This is the
same as last week.
same as last week.
New listings are still arriving too fast for demand to keep up, but the excess is smaller now than it was earlier
in the year.
in the year.
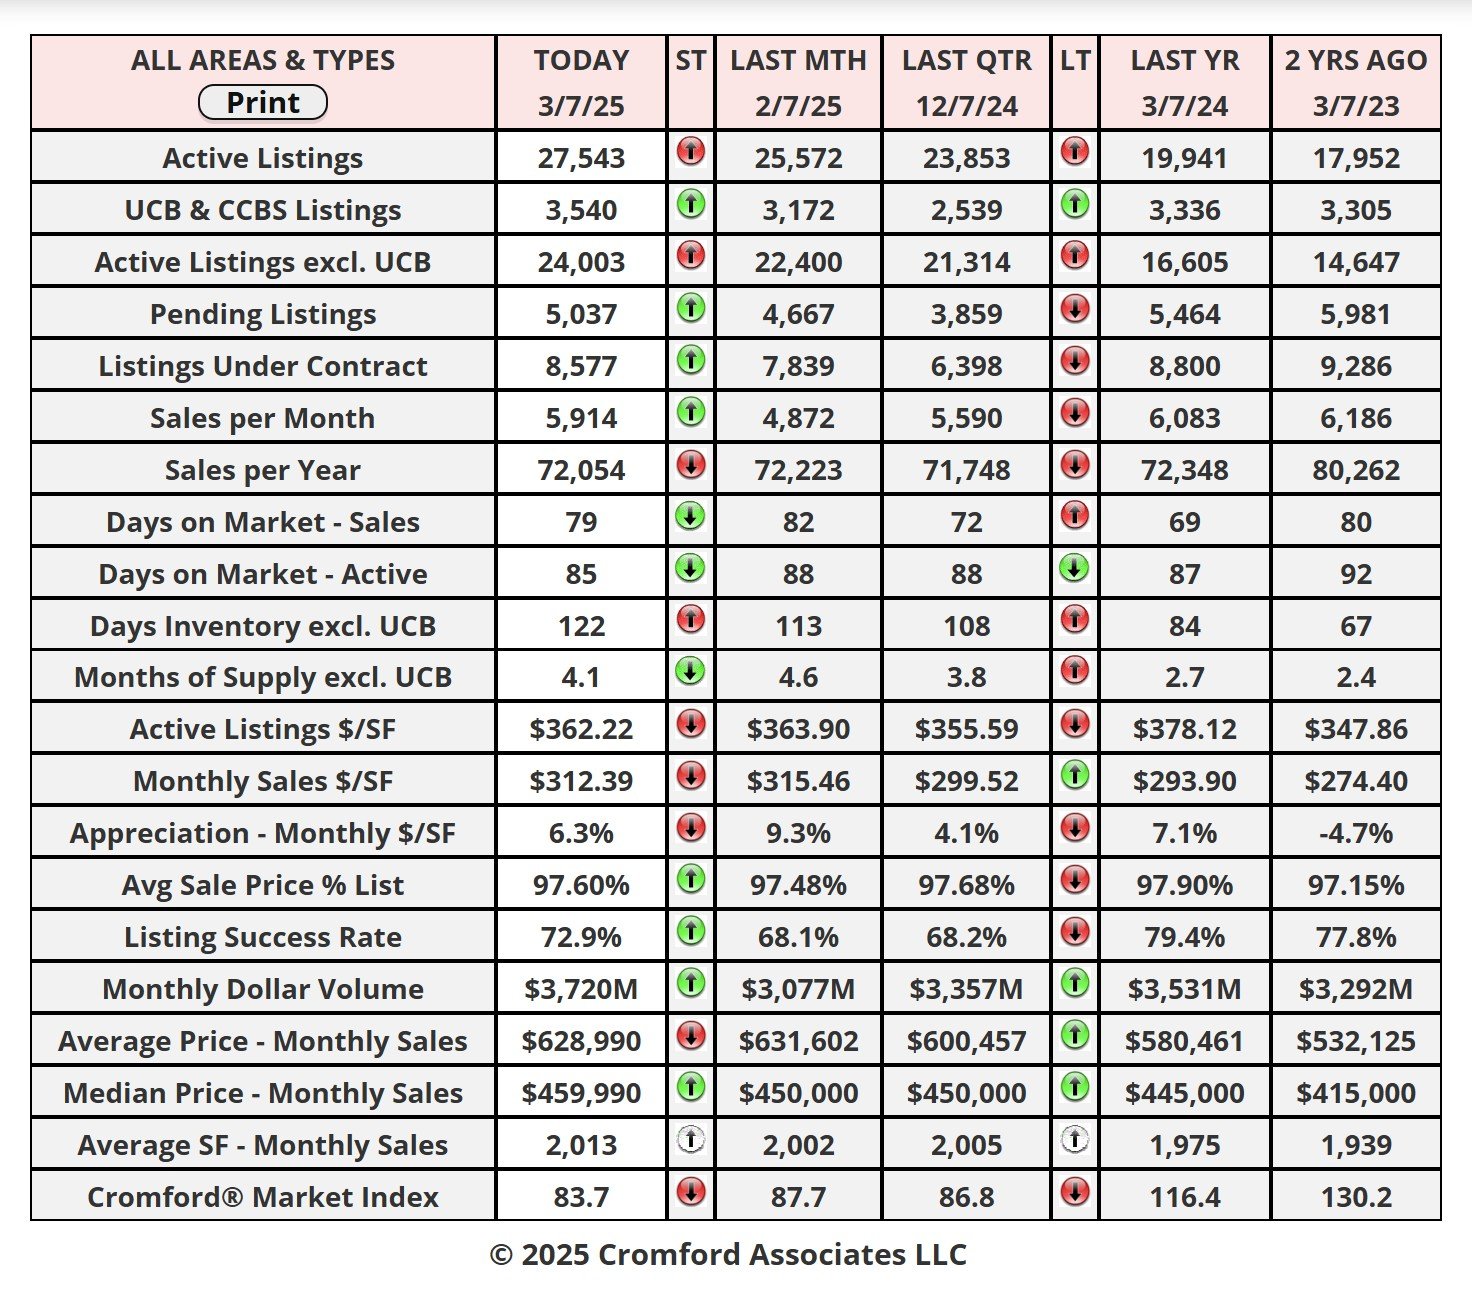
Affidavits of Value
Mar 5 - The affidavits of value have been counted and analyzed for Maricopa County's January filings and here is
what we found:
what we found:
• There were 6,000 closed transactions, up 1.1% from 5,933 in February 2024 and up 18% from January.
• There were 1,283 closed new homes, down 4.6% from 1,345 in February 2024 but up 13% from January.
• There were 4,717 closed re-sale transactions, up 2.8% from 4,588 in February 2024 and up 20% from
January.
• The overall median sales price in February was $488,613, up 4.6% from February 2024 and up 0.7% from
January.
• The new home median sales price was $530,000, up 2.7% from February 2024 but down 2.7% from January.
• The re-sale median sales price was $470,000, up 4.4% from February 2024 and up 2.2% from January.
Since February 2024 and February 2025 had a different number of working days (20 in 2025 and 21 in 2024),
we should make adjustments in interpreting the closing numbers. The 2025 closed transaction counts should
be increased by 5% to make a fair comparison.
Once again the top of the market is keeping both volumes and prices above where we might expect. This
effect was not quite as strong in February as the volume in the mid-range recovered from the seasonal low
point.
effect was not quite as strong in February as the volume in the mid-range recovered from the seasonal low
point.
New home market share fell again in February to 21.4%, and this is down from 22.7% a year ago.
These numbers are for single family and townhouse / condo homes.