
Market Statistics Report for March 18, 2025
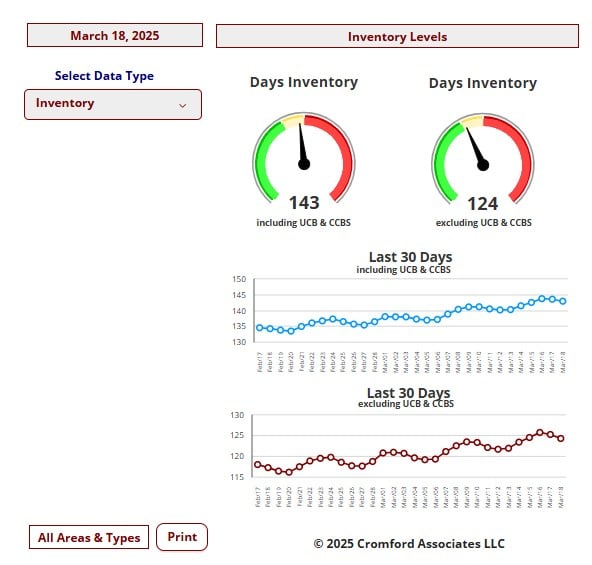
Market Dashboard – Inventory
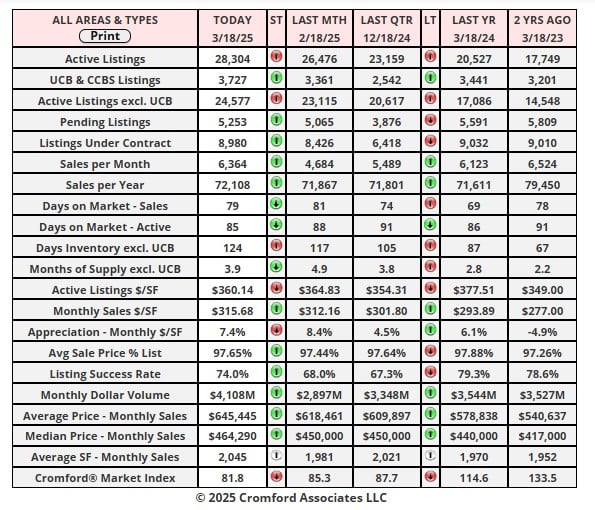
This Dashboard provides a comprehensive summary of the current state of the overall residential resale market.
All the statistics shown are for the entire Arizona Regional area as defined by ARMLS. All residential resale transactions
recorded by ARMLS are included. Geographically, this includes Maricopa County, a large part of Pinal County and a small
part of Yavapai county. In addition, "out of area" listings recorded on ARMLS are included, although these usually
constitute a very small percentage of total sales and have very little effect on the data.
All dwelling types are included. For-sale-by-owner, auctions and other non-MLS transactions are not included. Land,
commercial units, and multiple dwelling units are also excluded.
commercial units, and multiple dwelling units are also excluded.
City Ranking – Snapshot
This table ranks the cities by their annual average sales price per square foot. Only single family detached homes are
included in these numbers. Information for the large and secondary cities is current as of the date shown. Data for the
11 small cities is updated on a monthly basis, and is measured on the 13th of each month.The primary function of this
table is to show the least and most affordable areas in the Phoenix metropolitan area together with longer term pricing
trends.Annual averages are based on a relatively large number of sales. Therefore they are not as subject to rapid
change as monthly averages. The downside is that they do not necessarily represent the current market very
accurately, since they include sales from up to a year ago. Pricing may have moved a great deal since then.
Cromford Market Index
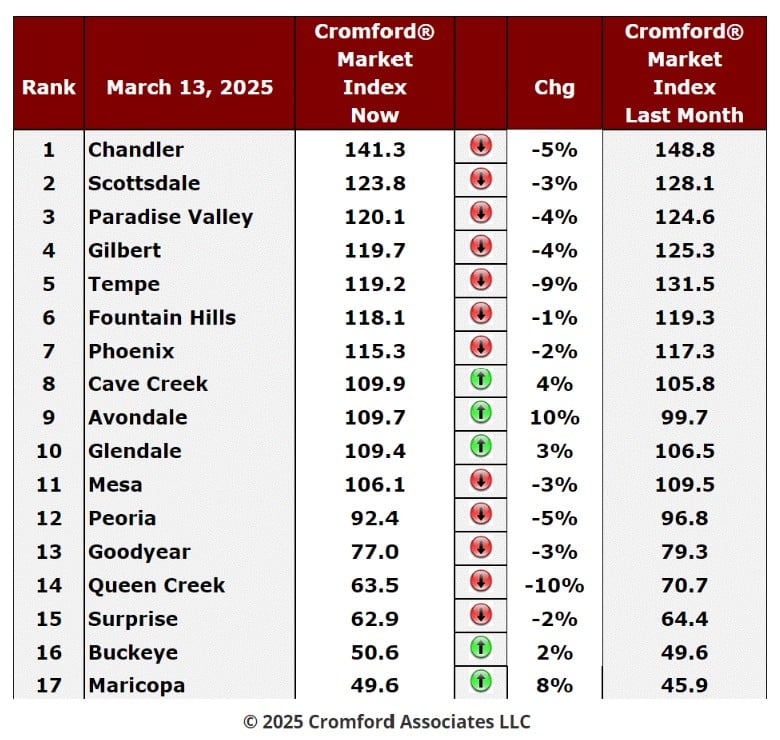
March 13 - Here is our latest table of Cromford® Market Index values for the single-family markets in the 17 largest
cities.
cities.
Cromford Market Index Commentary
The table is still reporting a swing in favor of buyers but the swing is gradually slowing down. We have 12
cities that have deteriorated for sellers over the last month and 5 that have improved. Avondale is the new
recruit. The average change in CMI over the past month is -1.5% while last week we saw -2.3%. This
continues the trend that started 3 weeks ago.
cities that have deteriorated for sellers over the last month and 5 that have improved. Avondale is the new
recruit. The average change in CMI over the past month is -1.5% while last week we saw -2.3%. This
continues the trend that started 3 weeks ago.
The fastest decliner is Queen Creek, which includes the large unincorporated county area known as San Tan
Valley. Tempe is at -9% but all other decliners fell by less than 6%.
Valley. Tempe is at -9% but all other decliners fell by less than 6%.
We have 7 cities that are still seller's markets, 5 that are balanced and 5 that are buyer's markets. There is
one fewer seller's market and an extra balanced city.
one fewer seller's market and an extra balanced city.
Demand has picked up a little with the slight drop in mortgage rates, but new listings continue to arrive in
strong numbers and the number of homes available for sale is still growing every week.
strong numbers and the number of homes available for sale is still growing every week.
Active Listing and Price per Square Foot
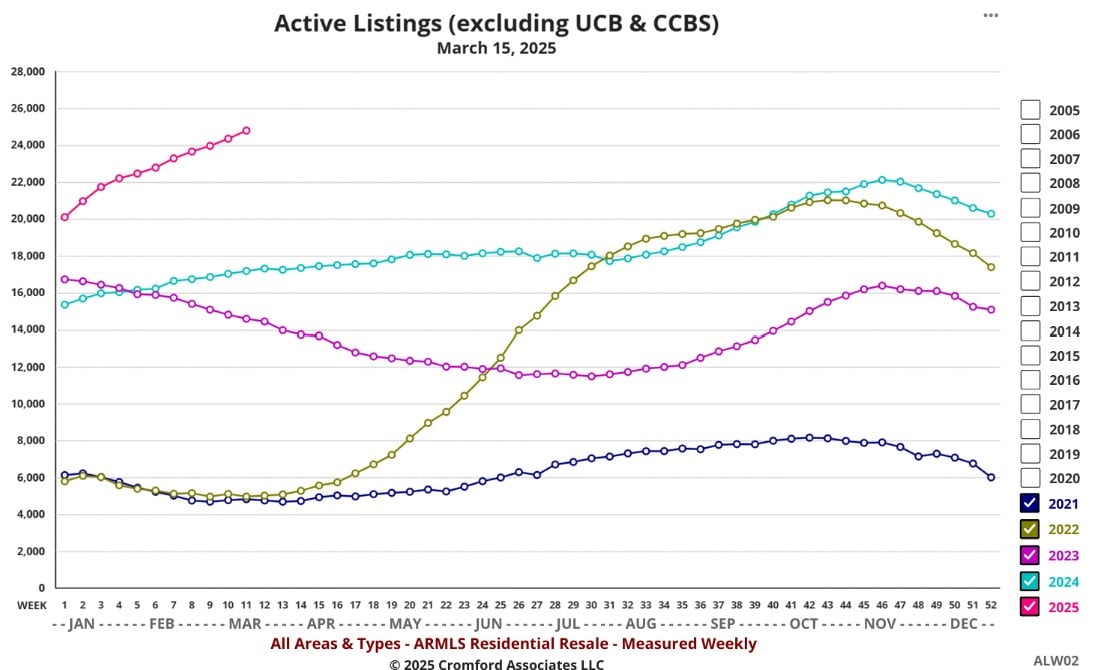
Mar 18 - The reason that active listing prices have declined so early in the year is that there are too many of
them. The chart below shows weekly readings for the past several years. 2025 is in red.
them. The chart below shows weekly readings for the past several years. 2025 is in red.
In 2021, 2022 and 2023 active listing counts dropped after the first couple of weeks of the year. 2024 saw
them grow steadily, but 2025 has seen them ramp much more quickly rising from 20,000 to nearly 25,000
after 11 weeks. These listings are offering lots of choice to buyers and giving sellers a problem they don't
need. Right now, there is no sign of the trend coming to an end. While demand has improved a little since
the start of the year, it is nowhere near the level needed to absorb this amount of inventory.
If we look back to 2005, inventory grew very quickly from April onwards and continued to grow throughout
2006 (apart from brief drops during the December holidays). It took 15 months before closed prices started
to weaken in mid 2006. Currently we have been in a buyer's market for only a short time, but closing prices
are still rising. Under current conditions, this is unlikely to last. First active pricing will fall. Then pricing for
under contract listings will fall. Then pricing for closed listings will fall. This process takes many months to
play out and is affected by seasonal patterns too, with the first and second quarters being strong and the
third week.
Things could always change, especially if we were to see a substantial drop in interest rates. However, on
the market's current trajectory, pricing will have to adjust down to get rid of the excess inventory.
Mar 16 - A new and unusual sign of market weakness can be found in the chart below:
the market's current trajectory, pricing will have to adjust down to get rid of the excess inventory.
Mar 16 - A new and unusual sign of market weakness can be found in the chart below:
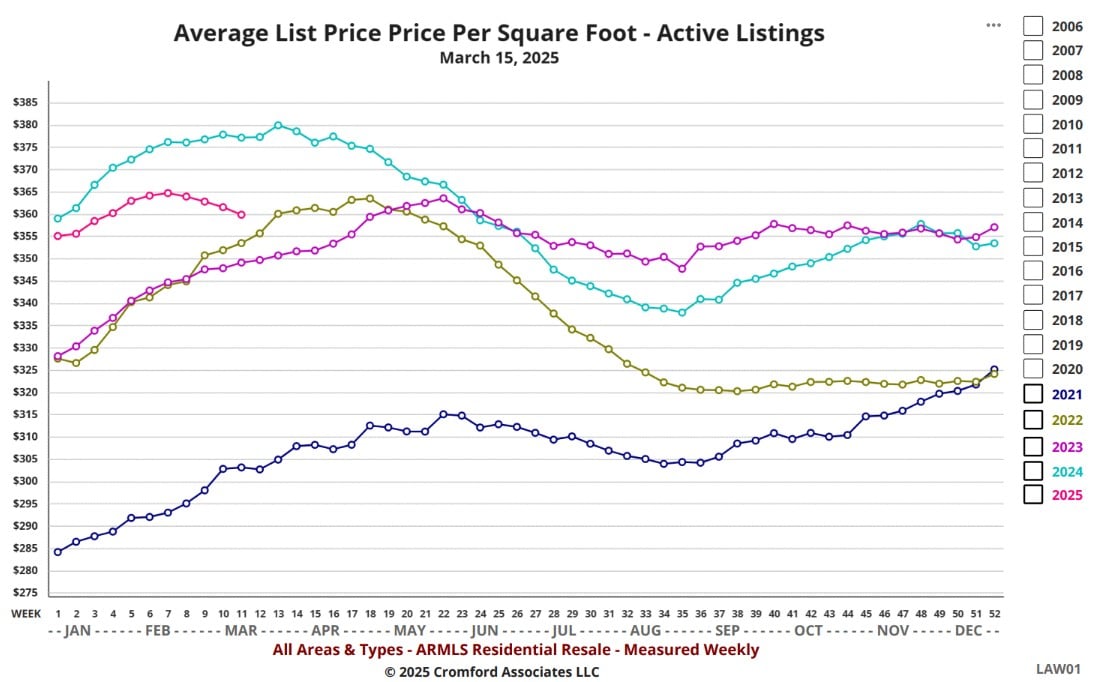
Note how the red line (2025) peaked in February and has started to decline. It is very rare for
asking price per square foot to peak this early in the year and the fact that the average has already
developed a distinct downward trend suggests a lack of confidence among sellers. A lack of
confidence which is very much justified given that supply continues to grow while demand remains
mediocre.
asking price per square foot to peak this early in the year and the fact that the average has already
developed a distinct downward trend suggests a lack of confidence among sellers. A lack of
confidence which is very much justified given that supply continues to grow while demand remains
mediocre.
2024 was not a great year for sellers, but asking prices peaked at the end of March - a full 6 weeks
later than 2025. In addition, we can see from our other charts that sellers are giving larger
concessions to buyers and more closings involve concessions.
later than 2025. In addition, we can see from our other charts that sellers are giving larger
concessions to buyers and more closings involve concessions.
Well-informed buyers now realize they have little competition from other buyers unless the home
is unusually desirable, so they can afford to be hard-nosed about the negotiation process. In
contrast, sellers are feeling a lot of competitive pressure from other sellers and are getting
increasingly nervous.
is unusually desirable, so they can afford to be hard-nosed about the negotiation process. In
contrast, sellers are feeling a lot of competitive pressure from other sellers and are getting
increasingly nervous.