recorded by ARMLS are included. Geographically, this includes Maricopa County, a large part of Pinal County and a small
part of Yavapai county. In addition, "out of area" listings recorded on ARMLS are included, although these usually
constitute a very small percentage of total sales and have very little effect on the data.
commercial units, and multiple dwelling units are also excluded.
City Ranking – Snapshot
This table ranks the cities by their annual average sales price per square foot. Only single family detached homes are
included in these numbers. Information for the large and secondary cities is current as of the date shown. Data for the
11 small cities is updated on a monthly basis, and is measured on the 13th of each month.The primary function of this
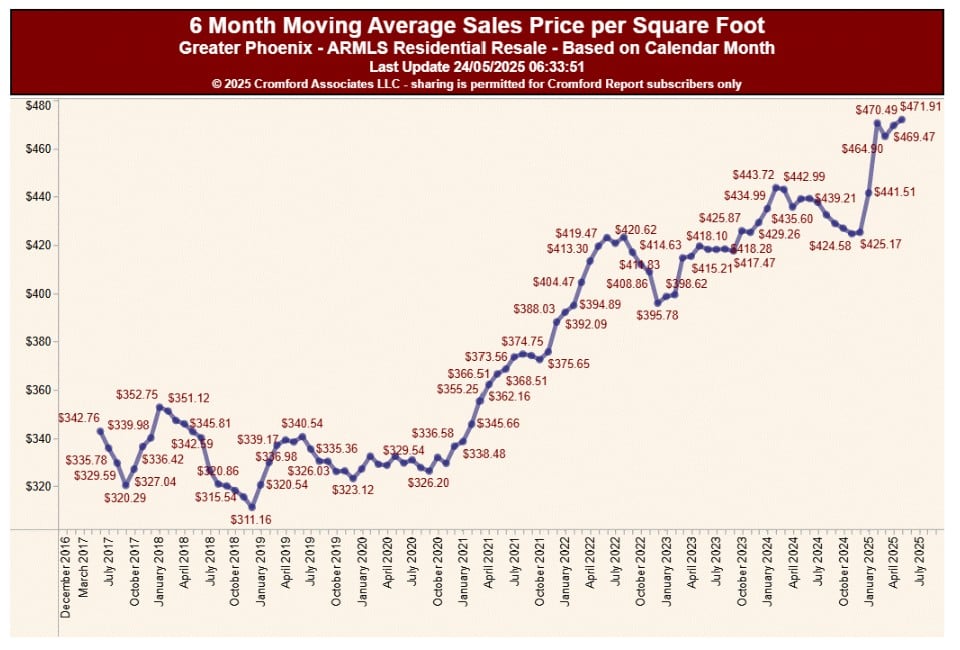
table is to show the least and most affordable areas in the Phoenix metropolitan area together with longer term pricing
trends.Annual averages are based on a relatively large number of sales. Therefore they are not as subject to rapid
change as monthly averages. The downside is that they do not necessarily represent the current market very
accurately, since they include sales from up to a year ago. Pricing may have moved a great deal since then.
cities.
than last week's -4.6%.
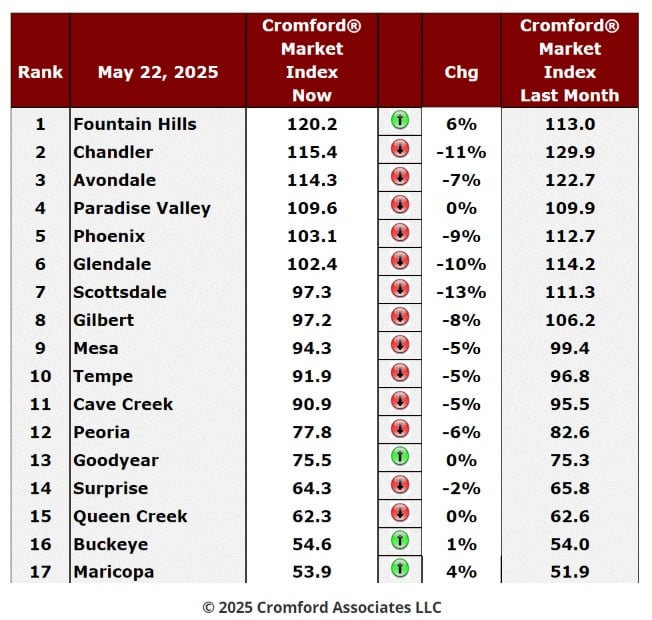
improved for buyers. Scottsdale, Chandler, Glendale and Phoenix have deteriorated the most for sellers. Fountain Hills
has improved the most and taken over the top spot from Chandler. Maricopa has also improved for sellers, but still has
not managed to catch Buckeye. Goodyear and Buckeye saw only marginal improvement.
buyer's markets.
worse.
potential home buyers and found that:
• More than a third of potential buyers surveyed by BMO said rates would need to drop to around 3% or less before
they’d be ready to step off the sidelines.
• The idea of buying a starter home and upgrading later is losing its appeal, with 58% of respondents viewing this
strategy as outdated.
not unusually high.
around 3% or less. To me this would indicate they are not really potential buyers, since the probability of seeing
mortgage rates at 3% or less in the next 10 years is very low indeed. Indeed, rates this low have rarely existed in
the last 100 years. Although we did see rates below 3% for a while between July 2020 and August 2021, that was
an abnormal period due to massive injection of liquidity by the government to offset the financial effects of the
COVID pandemic. Lenders could borrow funds at close to zero interest rate, so they could still make money lending
at 3%. This period gave us by far the lowest mortgage rates in history. Prior to this abnormality the lowest rate seen
was around 4% at the end of the Second World War. The long-term average for 30-year mortgages is about 7.75%,
higher than the current 7% or so. There is no likelihood of us seeing 3% or even 4% for a 30-year fixed loan in the
medium term. Let's get real.
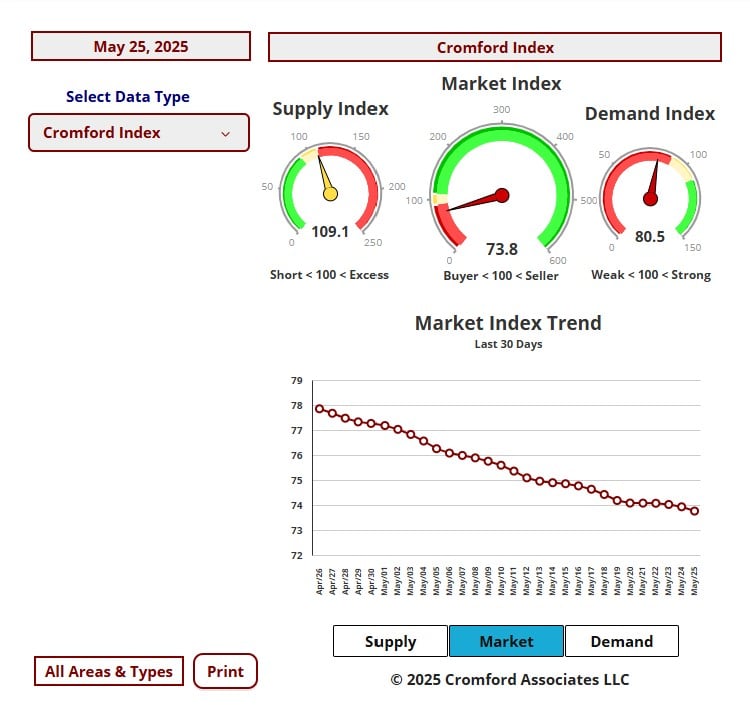
because there is serious potential for declining home prices when the Cromford® Market Index is below 90. This
means the ladder may go down just as you place your feet on it. However, you can count me as a strong believer
in the wisdom of having a foot on the ladder once the CMI goes back over 100 or even looks likely to be headed
that way.
properties in the less expensive parts of the valley.
This sub-market is pretty cold and as a result prices have been on a declining trend since the fourth quarter of
2023. With the current imbalance between plentiful supply and weak demand, we anticipate further price weakness
in this segment of the market.
reasonably strong. HOA finances tend to be better in these communities though there are exceptions.