
Market Statistics Report for September 16, 2024
Market Dashboard – Dashboard
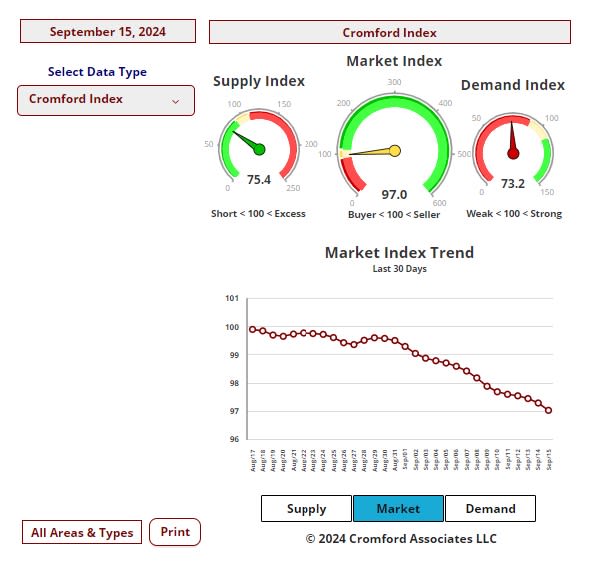
This Dashboard provides a comprehensive summary of the current state of the overall residential resale market.
All the statistics shown are for the entire Arizona Regional area as defined by ARMLS. All residential resale transactions
recorded by ARMLS are included. Geographically, this includes Maricopa County, a large part of Pinal county and a small
part of Yavapai county. In addition, "out of area" listings recorded on ARMLS are included, although these usually
constitute a very small percentage of total sales and have very little effect on the data.
All the statistics shown are for the entire Arizona Regional area as defined by ARMLS. All residential resale transactions
recorded by ARMLS are included. Geographically, this includes Maricopa County, a large part of Pinal county and a small
part of Yavapai county. In addition, "out of area" listings recorded on ARMLS are included, although these usually
constitute a very small percentage of total sales and have very little effect on the data.
All dwelling types are included. For-sale-by-owner, auctions and other non-MLS transactions are not included. Land,
commercial units, and multiple dwelling units are also excluded.
commercial units, and multiple dwelling units are also excluded.
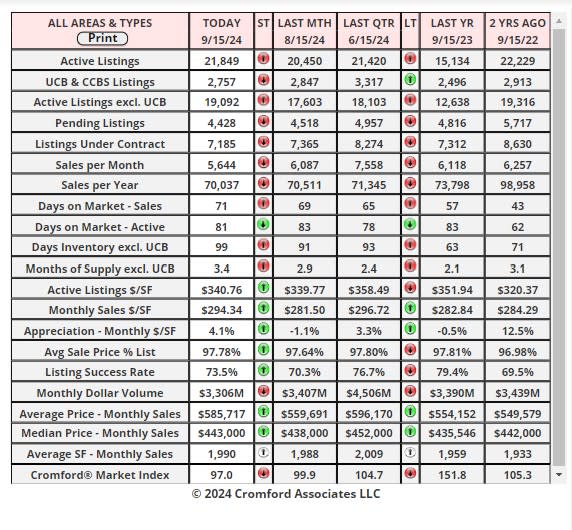
Daily Market Snapshot
The table below provides a concise statistical summary of today's residential resale market in the Phoenix metropolitan
area. The figures shown are for the entire Arizona Regional area as defined by ARMLS. All residential resale transactions
recorded by ARMLS are included. Geographically, this includes Maricopa county, the majority of Pinal county and a small
part of Yavapai county. In addition, "out of area" listings recorded in ARMLS are included, although these constitute a very
small percentage (typically less than 1%) of total sales and have very little effect on the statistics.
area. The figures shown are for the entire Arizona Regional area as defined by ARMLS. All residential resale transactions
recorded by ARMLS are included. Geographically, this includes Maricopa county, the majority of Pinal county and a small
part of Yavapai county. In addition, "out of area" listings recorded in ARMLS are included, although these constitute a very
small percentage (typically less than 1%) of total sales and have very little effect on the statistics.
Cromford Market Index
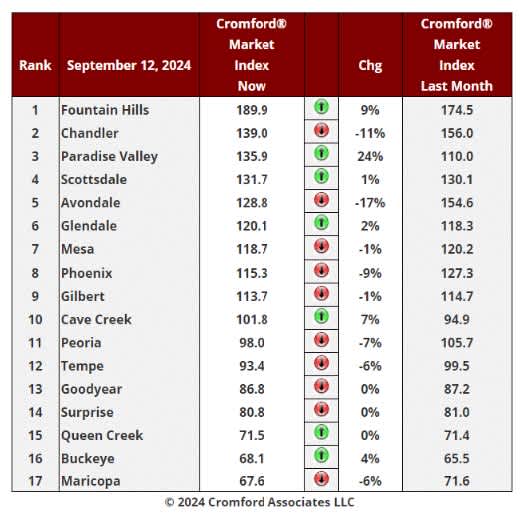
Sept 12 - Here is our latest table of Cromford® Market Index values for the single-family markets in the 17 largest
cities
cities
Cromford Market Index Commentary
The negative trend that started last week has continued and buyers are gaining an advantage, though the trend
remains mild.
remains mild.
There are 7 cities showing an increase in their Cromford® Market Index over the past month, one fewer than last
week. We also have 10 cities showing a decrease and that includes the two largest cities - Phoenix and Mesa.
week. We also have 10 cities showing a decrease and that includes the two largest cities - Phoenix and Mesa.
The average change in CMI over the past month is -0.7%. Last week we saw +0.1%. The average would be much
lower if it were not Paradise Valley, which is up sharply over last month.
Cave Creek and Fountain Hills are also showing decent percentage gains. In addition, Buckeye, Scottsdale, Queen
Creek and Glendale are all up over the last month, but not by much. The largest declines are to be found in
Avondale, Chandler, Phoenix, Peoria, Maricopa and Tempe.
lower if it were not Paradise Valley, which is up sharply over last month.
Cave Creek and Fountain Hills are also showing decent percentage gains. In addition, Buckeye, Scottsdale, Queen
Creek and Glendale are all up over the last month, but not by much. The largest declines are to be found in
Avondale, Chandler, Phoenix, Peoria, Maricopa and Tempe.
9 out of 17 cities remain seller's markets over 110, though 3 of these are below 120. We have 3 cities that are
balanced, while the remaining 5 are buyer's markets. Only 1 city l remain over 140 while 3 remain under 75.
balanced, while the remaining 5 are buyer's markets. Only 1 city l remain over 140 while 3 remain under 75.
Maricopa has taken over bottom place from Buckeye.
Despite this uninspiring picture, there is one sign of life. The total number of listings under contract has managed
to creep over 7,300 for the first time since August 29. We are up 1.5% from this time last month and only down
1.2% from a year ago. These percentages are slowly improving at last and it appears the lower mortgage rates
may be finally bringing a few more buyers out of hiding.
to creep over 7,300 for the first time since August 29. We are up 1.5% from this time last month and only down
1.2% from a year ago. These percentages are slowly improving at last and it appears the lower mortgage rates
may be finally bringing a few more buyers out of hiding.
Of course, many of these buyers will have to sell their existing house before they buy a new one, so it is natural
that an increase in active listings comes first.
that an increase in active listings comes first.
City Ranking Table
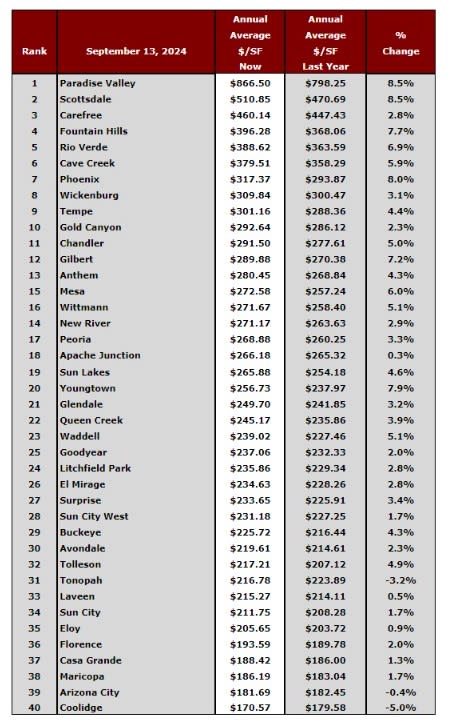
Sep 15 - The City Ranking Table lists the largest 40 cities or towns in Central Arizona by their annual average
price per square foot. We use the annual average to avoid the large variation that occurs when we use a monthly
average, This leads to more consistent results.
price per square foot. We use the annual average to avoid the large variation that occurs when we use a monthly
average, This leads to more consistent results.
As you would expect, Paradise Valley is consistently top of this table, and it has opened up a strong lead over
Scottsdale over the past 3 years.
Scottsdale over the past 3 years.
You can tell how well the luxury market has performed compared with the rest of the market because both PV
and Scottsdale are up 8.5% year over year, the highest percentages in the table. Not far behind are Fountain
Hills and Rio Verde. Carefree is falling behind a bit with only 2.8% but beware because this is a small market and
therefore subject to volatile numbers even on an annual average.
and Scottsdale are up 8.5% year over year, the highest percentages in the table. Not far behind are Fountain
Hills and Rio Verde. Carefree is falling behind a bit with only 2.8% but beware because this is a small market and
therefore subject to volatile numbers even on an annual average.
It is also clear that central locations have performed better than remoter ones. Phoenix is up 8%, the third best
return in the top 40 and the highest performing market outside the Northeast Valley. Also doing very well are
Youngtown (very much not a luxury area) and Gilbert.
return in the top 40 and the highest performing market outside the Northeast Valley. Also doing very well are
Youngtown (very much not a luxury area) and Gilbert.
The Southwest Valley is weaker than average with Avondale, Goodyear, Laveen and Litchfield Park all below
3%, though Tolleson is close to the center of the pack.
3%, though Tolleson is close to the center of the pack.
The worst performing areas have tended to be in outer locations, including Coolidge, Arizona City, Tonopah,
Eloy, Florence, Casa Grande, Gold Canyon and Apache Junction.
Eloy, Florence, Casa Grande, Gold Canyon and Apache Junction.
The 55+ areas have struggled a bit with both Sun City and Sun City West at 1.7%, though Sun Lakes is middle of-the-road at 4.6%
Sep 14 - Every election year people ask if the presidential election has a significant effect on the housing market.
The short answer is no.
There are always a few buyers who loudly claim they are deferring any home purchase decision until they find out
the result of the election. These people are a tiny proportion of the total, insignificant in the overall context. In fact
if we examine the volume of sales in the 5 months leading up to a November election we find that
the result of the election. These people are a tiny proportion of the total, insignificant in the overall context. In fact
if we examine the volume of sales in the 5 months leading up to a November election we find that
• in 2004 and 2020 home sales were stronger than normal non-election years
• in 2012 and 2016 home sales were in line with normal
• in 2000 and 2008 home sales were weaker than normal non-election years
• in 2012 and 2016 home sales were in line with normal
• in 2000 and 2008 home sales were weaker than normal non-election years
Notice that each line includes one win for the Republican nominee and one win for the Democratic candidate, so
sales volume does not even seem to correlate to who wins.
sales volume does not even seem to correlate to who wins.
The weaker years (2000 and 2008) correspond to recessions which are more likely to cause weaker home sales
than elections.
than elections.
The housing market is affected by life decisions and events like couples deciding to live together, have children,
separate, job moves and a death in the family. Politics has much less impact than politicians would have you
believe. The state of the economy and taxation rules will have a significant impact on the market. But predicting
how the economy will behave and what taxation changes might come into effect after a president's election
proposals have been heavily modified by congress is fraught with risk. Pundits will predict, but no-one is good at
this forecasting and results rarely match what is predicted. Unexpected events like epidemics have a more
dramatic effect on the housing market.
separate, job moves and a death in the family. Politics has much less impact than politicians would have you
believe. The state of the economy and taxation rules will have a significant impact on the market. But predicting
how the economy will behave and what taxation changes might come into effect after a president's election
proposals have been heavily modified by congress is fraught with risk. Pundits will predict, but no-one is good at
this forecasting and results rarely match what is predicted. Unexpected events like epidemics have a more
dramatic effect on the housing market.
So, the long answer is also no.